R offers a package manager named Comprehensive R Archive Network to help organize open source libraries. The most popular library within it is a graphic package called ggplot2.
ggplot2 is an open source graphics library for R that helps you create aesthetically pleasing charts. What makes this library unique is that it thinks of composing plots using layers that can be stacked on top of each other. Think, Photoshop for big data.
To get more technical, ggplot2 is built with the philosophy of 3 foundational elements:
- Dataframe is the object that holds your dataset. It's essentially a table with rows (observations) and columns (variables).
- Type of Graph to Make is the function that describes whether you want to make a bar chart or pie chart or whatever.
- Aesthetics are what you use to make the chart pretty. Within aesthetics, you can adjust the chart axes, colors, and shading).
Installing ggplot2
You install ggplot2 from within the R console. Simply open up Terminal and type:
Check for R
which r
Start R
r
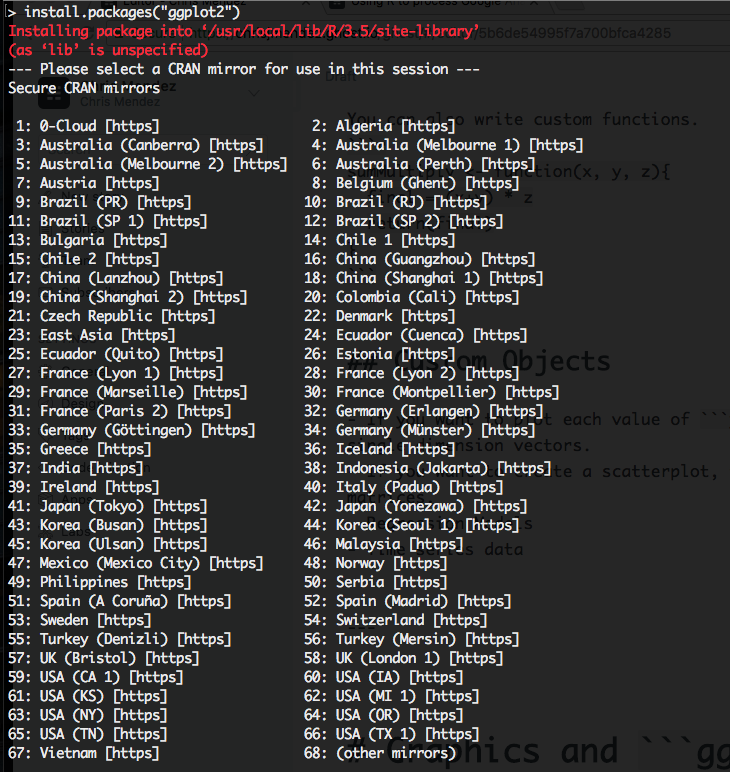
Install ggplot2 through CRAN
install.packages("ggplot2")
You will a menu that asks you where to download from:
Using ggplot2
ggplot2 comes with a dataset to work with so lets load this library.
library(ggplot2)
Next, we will use the mpg dataset and request the count for each type of car featured.
table(mpg$class)
Finally, let's generate a graphic using this same dataset.
barplot(table(mpg$class), main = "Base Graphics")