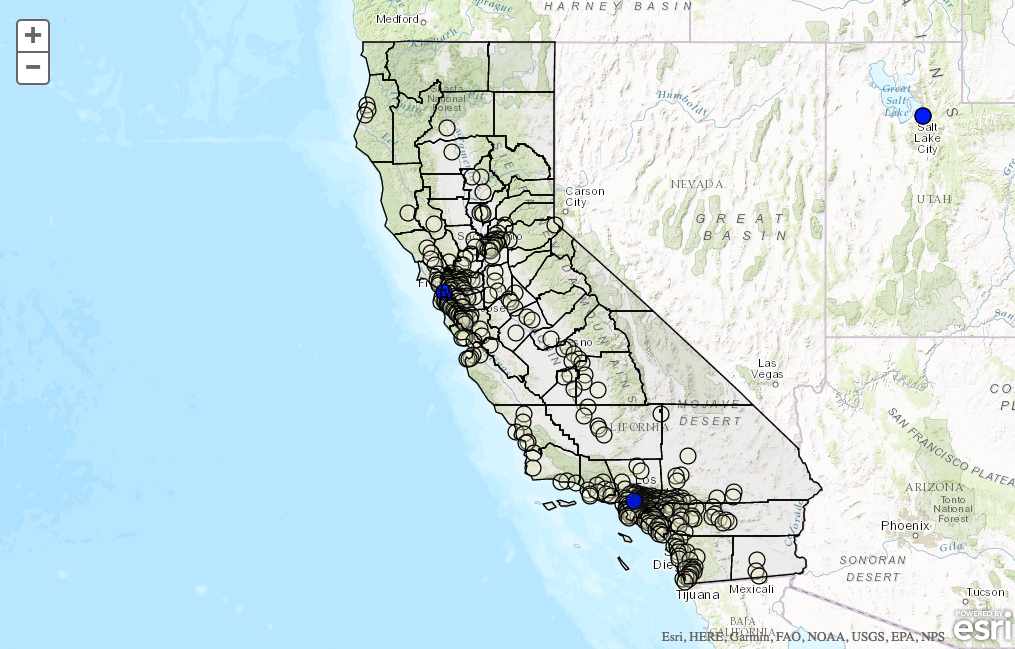
This single-page web app shows you how to publish a map using ArcGIS for mapping, ESRI for publishable data, and a JSON file for custom data. I took it one step further and even drew out vector graphics using the DOJO graphics engine.
Example
The hardest part of this demo was using the Dojo framework. Yes, it's still Javascript, but it's radically different from jQuery. If it weren't for ArcGIS, I might not have gone through the effort.
<!DOCTYPE html>
<html>
    <head>
        <meta http-equiv="Content-Type" content="text/html; charset=utf-8">
        <meta http-equiv="X-UA-Compatible" content="IE=7, IE=9, IE=10">
        <meta name="viewport" content="initial-scale=1, maximum-scale=1, user-scalable=no">
        <title></title>
        <link rel="stylesheet" href="http://js.arcgis.com/3.6/js/dojo/dijit/themes/tundra/tundra.css">
        <link rel="stylesheet" href="http://js.arcgis.com/3.6/js/esri/css/esri.css">
        <style>
            html, body, #mapDiv {
                height: 100%;
                width: 100%;
                margin: 0;
                padding: 0;
            }
        </style>
        <!-- Javascript -->
        <script src="http://js.arcgis.com/3.6/">
        </script>
        <script type="text/javascript" charset="utf-8">
            //https://developers.arcgis.com/en/javascript/jsapi/graphic-amd.html
            var map;
            var Data = {
                ESRI: {
                    CENSUS: "http://sampleserver1.arcgisonline.com/ArcGIS/rest/services/Demographics/ESRI_Census_USA/MapServer/3",
                    STATES_CITIES_RIVERS: "http://sampleserver1.arcgisonline.com/ArcGIS/rest/services/Specialty/ESRI_StatesCitiesRivers_USA/MapServer/0/"
                }
            }
            var params = {
                coords: {
                    lng: -118.049,
                    lat: 34
                },
                zoom: 6,
                markerURL: "https://s3.amazonaws.com/com.cartodb.users-assets.production/production/jonmrich/assets/20150203194453red_pin.png",
                state: "California"
            };

            var libs = ["dojo/parser", "dojo/on", "dojo/aspect", "dojo/dom", "dojo/io/script", "dojo/_base/array", "dojo/json", "esri/map", "esri/geometry/Point", "esri/symbols/PictureMarkerSymbol", "esri/graphic", "esri/layers/GraphicsLayer", "dojo/domReady!"];

            require(libs, function(parser, on, aspect, dom, script, arrayUtil, JSON, Map, Point, PictureMarkerSymbol, Graphic, GraphicsLayer, domConstruct){

                map = new Map("mapDiv", {
                    center: [params.coords.lng, params.coords.lat],
                    zoom: params.zoom,
                    //"satellite", "hybrid", "topo", "gray", "ocean", "osm", "national_geographic"
                    basemap: "topo"
                });


                //On Layers Add Event Handler
                map.on("layers-add-result", onLayerAddResult);
                function onLayerAddResult(res){
                    console.log("onLayerAddResult", res);
                }

                //Plot multiple layers on a map
                //https://developers.arcgis.com/en/javascript/jssamples/graphics_multiple_layers.html
                aspect.after(map, "onLoad", queryCounties);
                aspect.after(map, "onLoad", queryCities);

                on(map, "load", queryVenues);
                on(map, "load", plotItem);

                function plotItem(){
                    //A. CREATE GEO POINT
                    var point = new esri.geometry.Point(params.coords.lng, params.coords.lat);
                    point = esri.geometry.geographicToWebMercator(point);
                    //B. CREATE SYMBOL
                    var symbol = new esri.symbol.PictureMarkerSymbol(params.markerURL, 32, 32);
                    //C. CREATE GRAPHIC, INSERT THE SYMBOL AND POINT
                    var graphic = new esri.Graphic(point, symbol);
                    //D. CREATE LAYER
                    var layer = new esri.layers.GraphicsLayer();
                    //E. ADD GRAPHIC TO LAYER
                    layer.add(graphic);
                    //F. CREATE AN EVENT LISTENER + HANDLER
                    aspect.after(layer, "onclick", onPictureMarkerClick);
                    function onPictureMarkerClick(){
                        console.log("onPictureMarkerClick:");
                    }
                    //G. ADD LAYER TO MAP
                    map.addLayer(layer);
                }


                /**************************************
                 * Venue Data
                 */
                function queryVenues(){
                    script.get({
                        // The URL to get JSON from Twitter
                        url: "http://main-worldvenues.rhcloud.com/feed",
                        callbackParamName: "callback",
                        handleAs: "json",
                        content: {},
                        load: function(data){
                            var items = JSON.parse(data, true);

                            var symbol = new esri.symbol.SimpleMarkerSymbol();
                            symbol.setColor(new dojo.Color([0, 0, 255, 0.8]));

                            var graphicsLayer = new esri.layers.GraphicsLayer();
                            //Re-order the layers
                            //map.reorderLayer(graphicsLayer, 1);

                            //Add each item to the Graphics Layer
                            dojo.forEach(items.rows, function(item){
                                //console.log( item.value );
                                var item = item.value;
                                var lat = item.latitude;
                                var lng = item.longitude;
                                var point = new esri.geometry.Point(lng, lat);
                                var attr = item;
                                //https://developers.arcgis.com/en/javascript/jsapi/infotemplate.html
                                var infoTemplate = new esri.InfoTemplate("Venue", "${*}");
                                var g = new esri.Graphic(point, symbol, attr, infoTemplate);

                                graphicsLayer.add(g);
                            });
                            //Add Graphics Layer to Map
                            map.addLayer(graphicsLayer);
                        },
                        error: function(err){
                            console.log("Error!", err);
                        }
                    });
                }

                /*****************************************
                 * Single Data Point
                 */
                function plotProject(lat, lng){
                    var point = new esri.geometry.Point(lng, lat);

                    var symbol = new esri.symbol.SimpleMarkerSymbol();
                    symbol.setColor(new dojo.Color([0, 0, 255]));

                    var attr = {};
                    var infoTemplate = new esri.InfoTemplate("Special Marker", "${*}");
                    var graphic = new esri.Graphic(point, symbol, attr, infoTemplate);

                    var graphicsLayer = new esri.layers.GraphicsLayer();
                    graphicsLayer.add(graphic);

                    //Add Graphics Layer to Map
                    map.addLayer(graphicsLayer);
                    //map.reorderLayer(graphicsLayer, 2);

                    //We're using graphicLayer instead of raw Symbol on a map
                    //map.graphics.add(graphic);
                }

                /**************************************
                 * County Data
                 */
                function queryCounties(){
                    var param = params.state;
                    var countyQueryTask = new esri.tasks.QueryTask(Data.ESRI.CENSUS);

                    var countyQuery = new esri.tasks.Query();
                    countyQuery.outFields = ["*"];
                    countyQuery.returnGeometry = true;
                    countyQuery.outSpatialReference = map.spatialReference;
                    countyQuery.where = "STATE_NAME = '" + param + "'";
                    countyQueryTask.execute(countyQuery, addCountyFeatureSetToMap);
                }

                function addCountyFeatureSetToMap(featureSet){
                    var symbol = new esri.symbol.SimpleFillSymbol();
                    symbol.setColor(new dojo.Color([100, 100, 100, 0.1]));

                    //Create graphics layer for counties
                    var graphicsLayer = new esri.layers.GraphicsLayer();
                    graphicsLayer.setInfoTemplate(new esri.InfoTemplate("${NAME}", "${*}"));

                    map.addLayer(graphicsLayer);
                    //map.reorderLayer(graphicsLayer, 2);

                    //Add counties to the graphics layer
                    dojo.forEach(featureSet.features, function(feature){
                        graphicsLayer.add(feature.setSymbol(symbol));
                    });
                }

                /*****************************************
                 * City Data
                 */
                function queryCities(){
                    var param = params.state;
                    //Query all cities in...
                    var cityQueryTask = new esri.tasks.QueryTask(Data.ESRI.STATES_CITIES_RIVERS);
                    var cityQuery = new esri.tasks.Query();
                    cityQuery.outFields = ["*"];
                    cityQuery.returnGeometry = true;
                    cityQuery.outSpatialReference = map.spatialReference;
                    cityQuery.where = "STATE_NAME = '" + param + "'";
                    cityQueryTask.execute(cityQuery, addCityFeatureSetToMap);
                }

                function addCityFeatureSetToMap(featureSet){
                    var symbol = new esri.symbol.SimpleMarkerSymbol();
                    symbol.setColor(new dojo.Color([250, 250, 210, 0.3]));

                    //Create graphics layer for cities
                    var graphicsLayer = new esri.layers.GraphicsLayer();
                    graphicsLayer.setInfoTemplate(new esri.InfoTemplate("${CITY_NAME}", "${*}"));

                    map.addLayer(graphicsLayer);
                    map.reorderLayer(graphicsLayer, 1);

                    //Add cities to the graphics layer
                    dojo.forEach(featureSet.features, function(feature){
                        graphicsLayer.add(feature.setSymbol(symbol));
                    });
                }

            });
        </script>
    </head>
    <body class="tundra">
    <div id="mapDiv">
    </div>
    </div>
</body>
</html>
Final Thoughts
If you're trying to work with dynamic data and mapping, I highly suggest you look at Google Maps API with jQuery. Here's an example I made which also displays data from Flickr.


Subscribe to new posts
Processing your application
Please check your inbox and click the link to confirm your subscription
There was an error sending the email